|
|
|
|
|
|
|
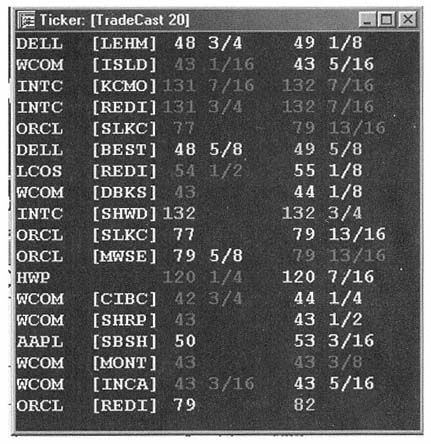
own list of stocks to watch, and that allow you to color-code the quote changes (rising quotes in one color, falling quotes in another) so that you can easily see when quoted prices are rising or falling. Again, this information, as shown in Figure 6.7, helps you time your orders. |
|
|
|
|
|
|
|
|
Figure 6.7
Sample Ticker Window
Copyright 2000, TradeCast® Ltd. |
|
|
|
|
|
|
|
|
Charts are used for identifying trends and, as we will see in Chapter 11, finding high-probability chart patterns. These are fully-customizable |
|
|
|
|
|