|
|
|
|
|
|
|
An entirely new pricing dynamic is now at work. Prices are free to rise. We are in uncharted territory. We don't know how far the prices will rise, so we have to find the new resistance level. |
|
|
|
|
|
|
|
|
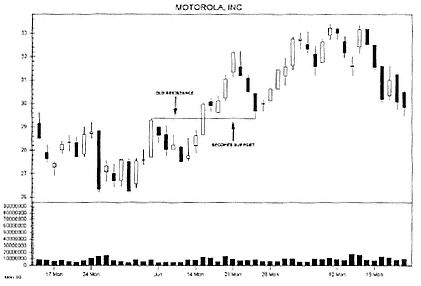
We also don't know how far the prices are likely to fall. But we don't have to look too hard to find the new support level. As shown in Figure 12.19, it is a reliable axiom that a punctured resistance level becomes the new support level. |
|
|
|
|
|
|
|
|
Figure 12.19
Resistance Chart
Copyright 2000, TradeCast® Ltd. |
|
|
|
|
|
|
|
|
Trendlines and Moving Averages |
|
|
|
|
|
|
|
|
Trendlines are an improvement over simple support and resistance lines. Trendlines help to identify trends and to show absolute points of support and resistance. |
|
|
|
|
|
|
|
|
One of the most useful type of trendlines is the moving average, which will smooth the price series to make it easier to see the trend. Moving averages can be precisely drawn. Every chart software package |
|
|
|
|
|