|
|
|
|
|
|
|
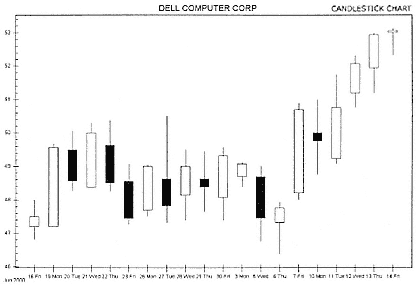
candlestick formations. Figure 12.3 shows a Japanese candlestick chart for Dell for the same period as the line chart in Figure 12.2. |
|
|
|
|
|
|
|
|
Figure 12.3
Japanese Candlestick Chart
Copyright 2000, TradeCast® Ltd. |
|
|
|
|
|
|
|
|
You can see that these two charts have a similar shape to them but there is quite a bit more information on the candlestick chart. What is it telling us? |
|
|
|
|
|
|
|
|
As you look at Figure 12.4, you can see eight important pieces of information about your selected stock for the chosen time period: |
|
|
|
|
|
|
|
|
5. Trading range for the period |
|
|
|
|
|
|
|
|
6. Relationship of the close to the high |
|
|
|
|
|
|
|
|
7. Relationship of the open to the low |
|
|
|
|
|
|
|
|
8. Net change from open to close |
|
|
|
|
|